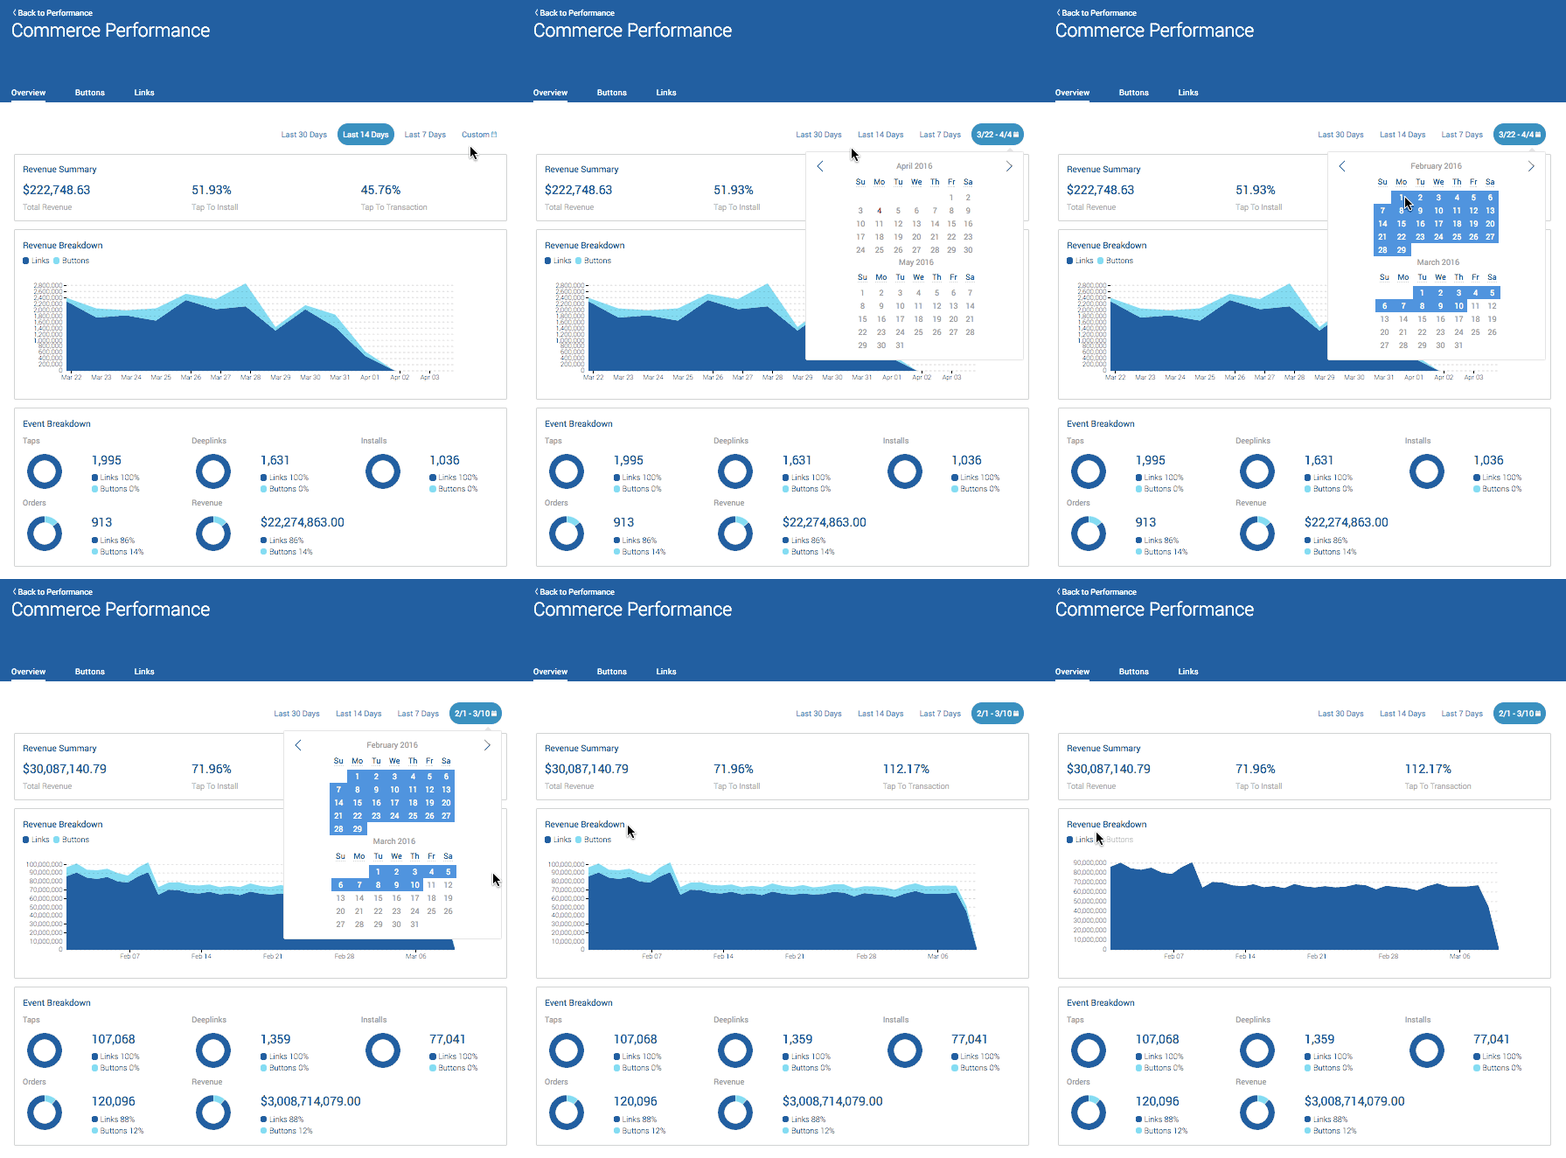
We know that understanding performance is key to accessing insights about the health of your business. At Button, it’s our mission to help our partners grow and earn revenue. We’re always trying to build the best tools to understand sources of that revenue and new high value users. Today we’re introducing transaction-level data into your metrics, allowing you to see beyond taps and installs, with clear insight into how Buttons affect your bottom-line.
As part of this, we’ve also changed how we report and visualize performance metrics for your Buttons. With the new Performance page in the Dashboard you get both a holistic understanding of your Buttons’ performance, as well as the ability to see deeper views that will help with optimization.
-
See a snapshot of your performance – you can now easily see an executive summary of your performance. For publishers this means the commission you have received, and for commerce companies, this means the total revenue driven from your publishers.
-
Understand trends and drop-off – you can now see trends for all the actions you care about (from tap to transaction). You can even see your tap-to-install (CTI) and tap-to-transaction rates to understand where drop-off occurs for your Buttons. Even filter by operating system to see how your Buttons perform across iOS or Android.
-
Quickly glean insights from visualizations – your data is now better visualized so that you can understand key sources of growth and revenue with ease.

To get started, jump into the Dashboard here. To learn more about how to monetize your app or grow your commerce company with Button, head over to our website.
